
Exploring Data Analysis Techniques for Auditors Using R
The ability to analyze data efficiently is essential to provide value to internal audit clients. As auditors, leveraging tools like R can significantly enhance our capabilities in detecting anomalies and understanding patterns within financial data. In this blog post, we’ll explore practical ways to utilize R along with ggplot2 and dplyr packages to identify outliers and visualize our findings, all without needing to import external data.
Setting Up Your R Environment
Before we begin, ensure you have R and RStudio installed on your computer. If not, you can download them from CRAN and RStudio.
Generating a Sample Dataset
To illustrate the process, let’s create a mock dataset representing financial transactions. We’ll generate this data using R directly:
# Generating a sample dataset
set.seed(123)  # Setting seed for reproducibility
data <- data.frame(
  Transaction_ID = 1:100,
  Amount = c(rnorm(90, mean = 1000, sd = 200), rnorm(10, mean = 5000, sd = 500))
)
# Adding an outlier
data$Amount[100] <- 15000
# View the dataset
head(data)
##   Transaction_ID    Amount
## 1              1  887.9049
## 2              2  953.9645
## 3              3 1311.7417
## 4              4 1014.1017
## 5              5 1025.8575
## 6              6 1343.0130
In this dataset: – Transaction_ID represents unique transaction identifiers. – Amount simulates transaction amounts, with an intentional outlier added for illustration.
Identifying Outliers Using dplyr
Now, let’s use the dplyr package to identify outliers based on a Z-score threshold:
library(dplyr)
##
## Attaching package: 'dplyr'
## The following objects are masked from 'package:stats':
##
##     filter, lag
## The following objects are masked from 'package:base':
##
##     intersect, setdiff, setequal, union
# Calculate Z-scores
data <- data %>%
  mutate(Zscore = (Amount - mean(Amount)) / sd(Amount))
# Filter outliers (Z-score greater than 3)
outliers <- data %>%
filter(abs(Zscore) > 3)# View the outliers
outliers
##   Transaction_ID Amount   Zscore
## 1            100  15000 7.281672
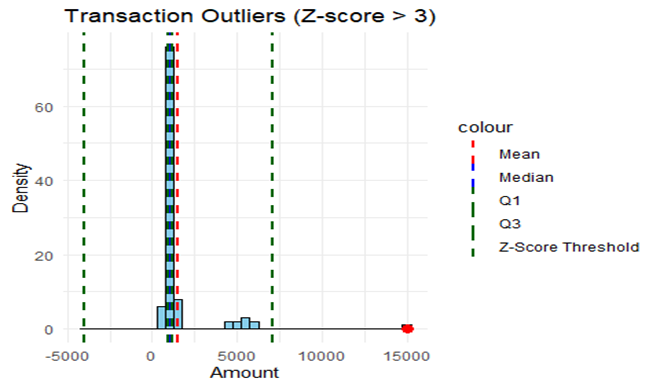
Visualizing Outliers with ggplot2
To visualize the outliers detected, we’ll use ggplot2 to create a histogram with a density plot overlay:
library(ggplot2)
# Create a histogram with density plot
ggplot(data, aes(x = Amount)) +
  geom_histogram(binwidth = 500, fill = "skyblue", color = "black") +
  geom_density(alpha = 0.6, fill = "#FFA500") +
  geom_vline(aes(xintercept = mean(Amount), color = "Mean"), linetype = "dashed", size = 1) +
  geom_vline(aes(xintercept = median(Amount), color = "Median"), linetype = "dashed", size = 1) +
  geom_vline(aes(xintercept = quantile(Amount, 0.25), color = "Q1"), linetype = "dashed", size = 1) +
  geom_vline(aes(xintercept = quantile(Amount, 0.75), color = "Q3"), linetype = "dashed", size = 1) +
  geom_vline(aes(xintercept = mean(Amount) + 3*sd(Amount), color = "Z-Score Threshold"), linetype = "dashed", size = 1) +
  geom_vline(aes(xintercept = mean(Amount) - 3*sd(Amount), color = "Z-Score Threshold"), linetype = "dashed", size = 1) +
  geom_point(data = outliers, aes(x = Amount, y = 0), color = "red", size = 3) +
  scale_color_manual(values = c("red", "blue", "darkgreen", "darkgreen", "darkgreen")) +
  labs(title = "Transaction Outliers (Z-score > 3) ",
       x = "Amount",
       y = "Density") +
    theme_minimal()
Conclusion
In this blog post, we’ve shown how R and the ggplot2 and dplyr packages can be powerful tools for internal auditors to analyze and visualize financial data. First, by creating a sample dataset directly in R, then identifying outliers using Z-scores with dplyr, and finally, visualizing the findings with ggplot2, auditors can gain deeper insights into transaction patterns and anomalies.
Understanding these techniques improves audit efficiency and strengthens the ability to spot potential risks and irregularities within financial datasets. As you explore R for data analysis, remember to adapt these methods to fit your specific audit needs and datasets.
Happy auditing with R!
Note: For further learning, refer to the official documentation and tutorials provided by RStudio, ggplot2, and dplyr communities.
This guest article is written by Stephen Vigil who works as an Accounting Contractor at Vigilant Financial Enterprises LLC